Skip to content
You can now search across every topic, entity and event.What's new
MonitoringEconomic· Active since 27 July 2026

Is Britain Actually Broke?

A standing ledger of every stressed British balance sheet, with the receipts

3 updates · 50 entities · 44 days active

Current Assessment

This fortnight's fiscal figures are forecasts checked against forecasts, not outturns, until 28 October.

#3
3Sept15:29

Debt ratio fell; borrowing missed by £2.3bn

Britain's debt fell to 94.1% of GDP at the end of July, 0.3 points below the OBR forecast, while borrowing in the same bulletin ran £2.3bn above it. The ratio improved because the economy was re-measured, not because borrowing did. Five of the nine ledgers published nothing at all, and the forecast everything is judged against does not refresh until 28 October.

Read full update
#2
20Aug17:53

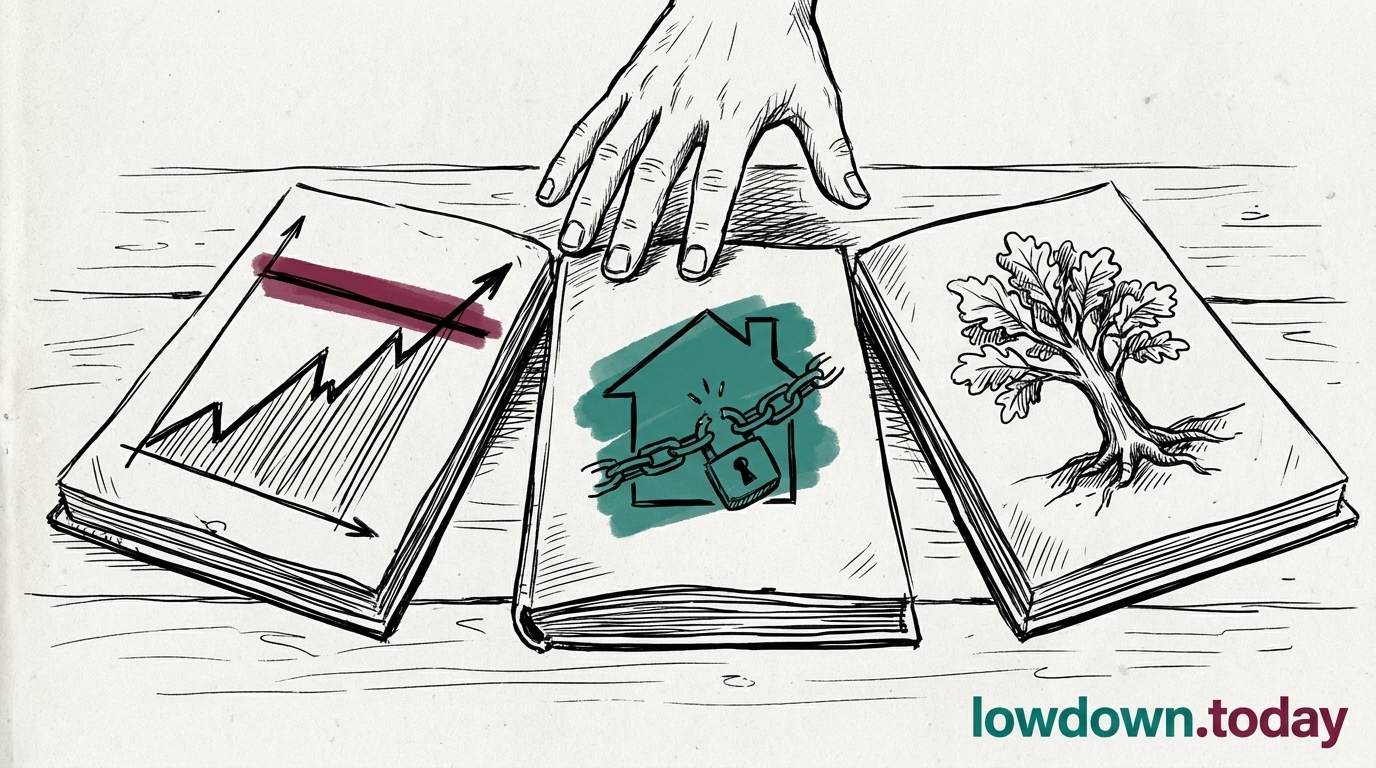
Three household registers, three answers

Britain's individual insolvency rate reached 27.8 per 10,000 adults in the year to July, narrowing the distance to this desk's declared 30.0 trigger from 2.9 to 2.2. In the same window mortgage arrears and possessions fell, and pension schemes reached their strongest funding on record for this index. Which register you read decides the answer you get.

Three household registers, three answers
Read full update
#1
27Jul11:11

The distress moved from banks to councils

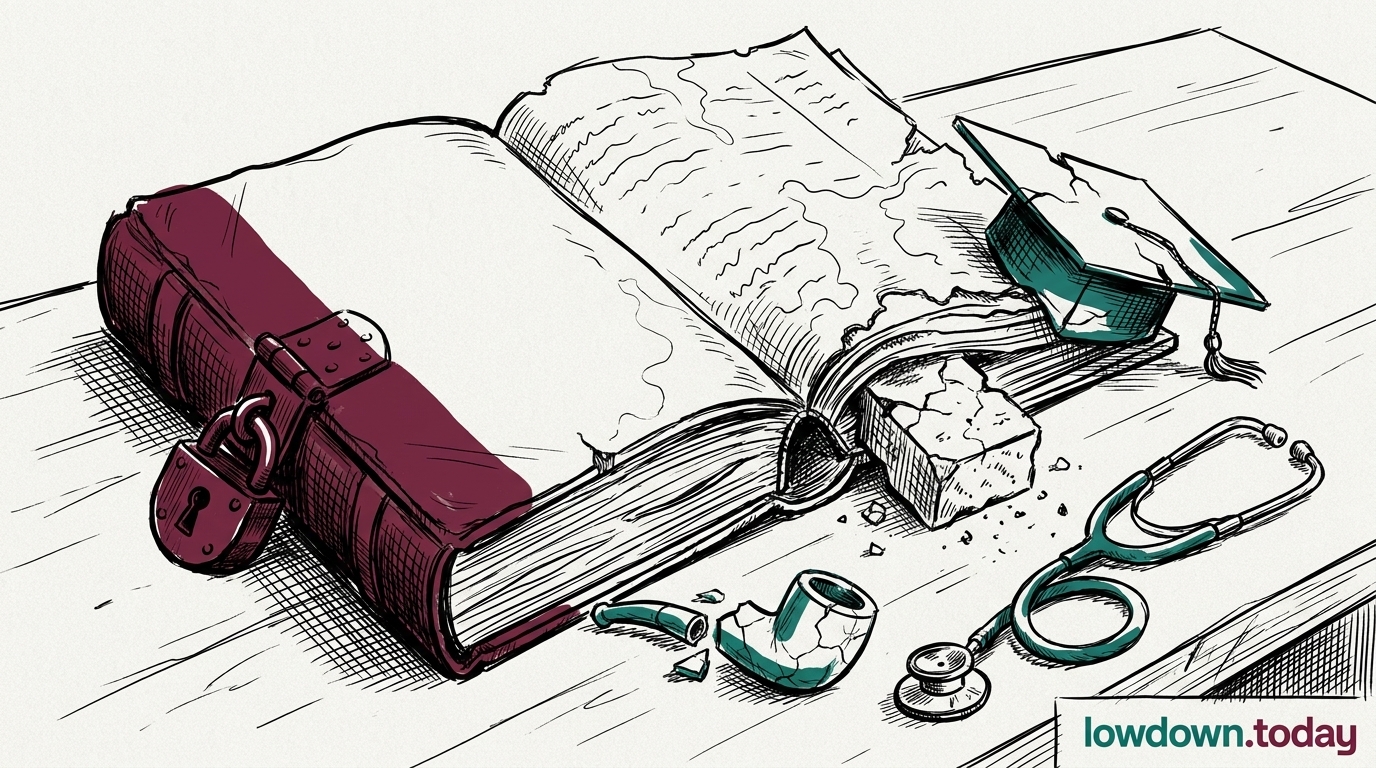
Britain's national debt passed £2,989.9bn in June 2026, but the balance sheets in trouble are not the ones 2008 taught everyone to watch. Banks passed a severe stress test and had their capital requirement cut; company pension schemes hold a £264.0bn surplus. The distress has moved to councils, water, universities and the NHS. Every future briefing measures against this baseline ledger.

The distress moved from banks to councils
Read full update