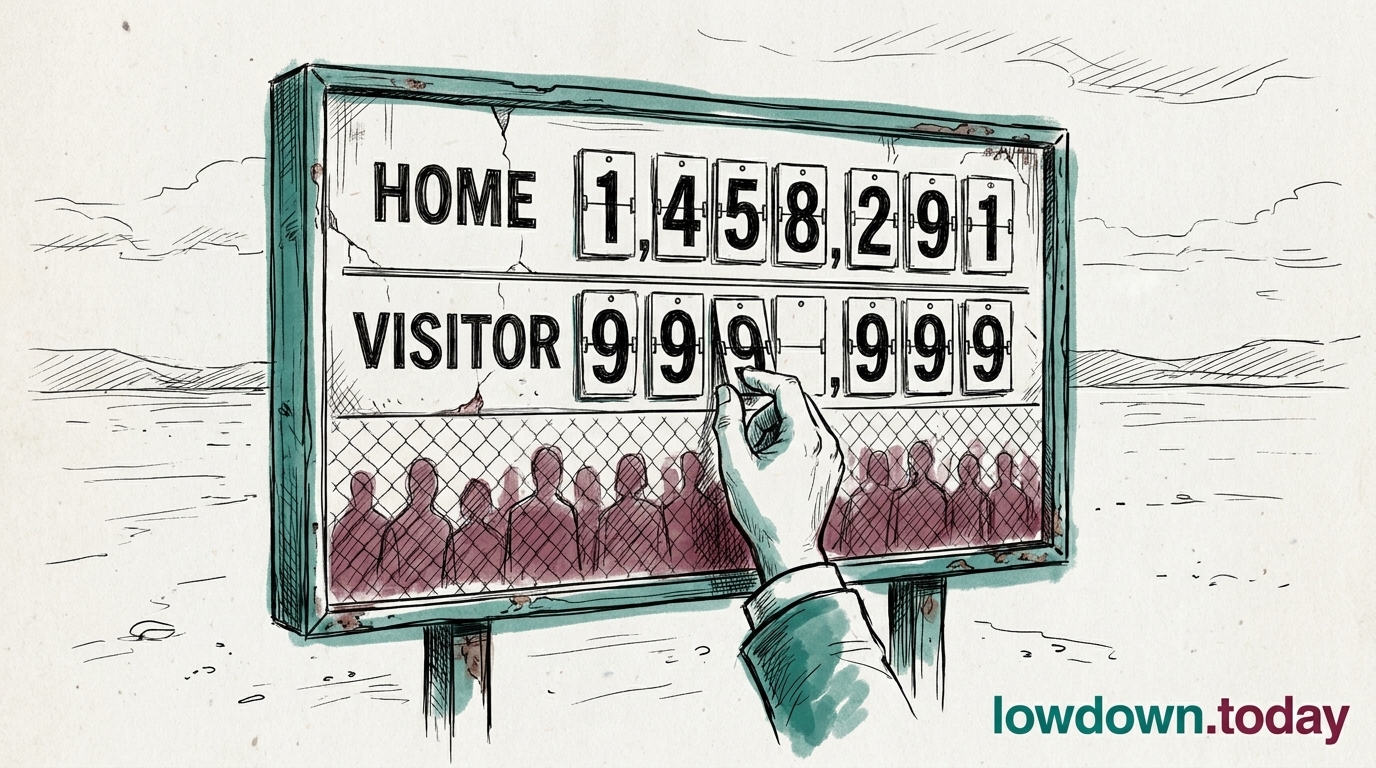
FIFA's published total of 6,810,966 spectators across 104 matches, the largest aggregate in World Cup history, reached the public through the wires the day after the final. Divide the total by the fixture count and the average crowd is 65,490. USA 1994 drew 3,587,538 people to 52 matches, an average of 68,991, so the per-match record set 32 years ago still stands. That arithmetic is ours, worked from the per-venue figures published after the final1.
Every stadium ran between 99.1% and 100% of its own capacity, which rules out any shortfall in demand. Mexico City Stadium averaged 80,824 across five matches and Toronto Stadium averaged 43,015 across six, but the 1.88 times spread between them measures how many seats exist rather than how many people wanted one2. The total was fixed on the day FIFA allocated fixtures to venues.
This schedule ran twice as long as 1994's and 40 fixtures longer than Qatar's, yet the extra matches were spread across the full venue list rather than concentrated in the largest bowls. A further expansion would repeat the same arithmetic at greater scale: a bigger aggregate, a longer fixture list, and more of the added matches in the smaller stadiums at the bottom of the capacity table. Headline record and per-match figure would move in opposite directions again.